
Business and Services
Start of main content
E_09
Evolution of income by occupancy and activity rates (E_09)
The evolution, in recent years, of the income by occupancy and activity rates, along with the percentage of each of them with respect to the net turnover was:
| 2018 | 2019 | 2020 | |
|---|---|---|---|
| Revenue | 45,291,597 | 45,129,705 | 42,837,290 |
| Occupancy charge | 9,113,524 | 9,317,085 | 9,228,256 |
| RATIO (%) | 20.12% | 20.65% | 21.54% |
| Activity charge | 5,277,468 | 4,998,569 | 4,500,855 |
| RATIO (%) | 11.65% | 11.08% | 10.51% |
E_10
Evolution of the tonnes moved per commercial use square metre (E_10)
In recent years, the evolution of tons moved per square meter of the land service area for commercial use was:
| 2018 | 2019 | 2020 | |
|---|---|---|---|
| Tonnes moved | 32,996,864 | 33,813,726 | 29,919,220 |
| Commercial space m2 | 5,245,600 | 5,246,600 | 5,246,600 |
| Mt/m2 | 6.28 | 6.44 | 5.70 |
E_11
Evolution of the tonnes moved per linear metre of operational Wharf (E_11)
The evolution in recent years of the tons moved per linear metre of operational Wharf was:
| 2018 | 2019 | 2020 | |
|---|---|---|---|
| Tonnes moved | 32,996,864 | 33,813,726 | 29,919,220 |
| Linear metres of active dock space | 7,745 | 7,413 | 7,413 |
| Tm/m | 4,260.41 | 4,561.41 | 4,036.05 |
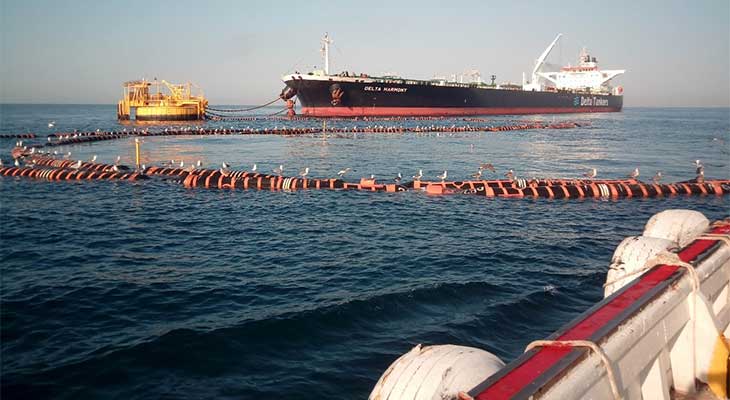
It should be noted that an important part of the traffic of the Port of Huelva, nearly 26.96%, was through a monobuoy (8,066,009 Tm of crude oil in 2020).
End of main content