
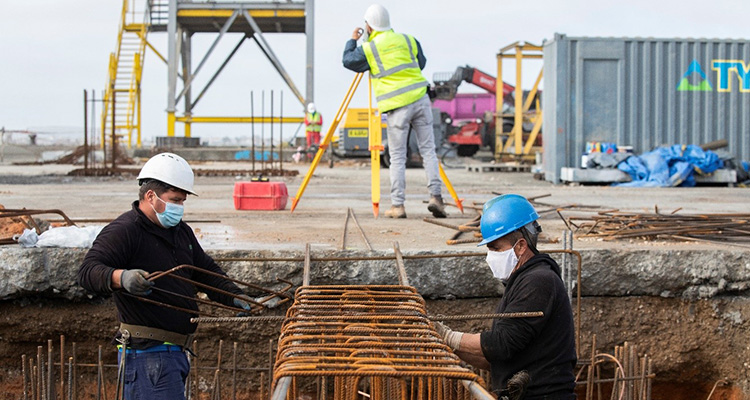
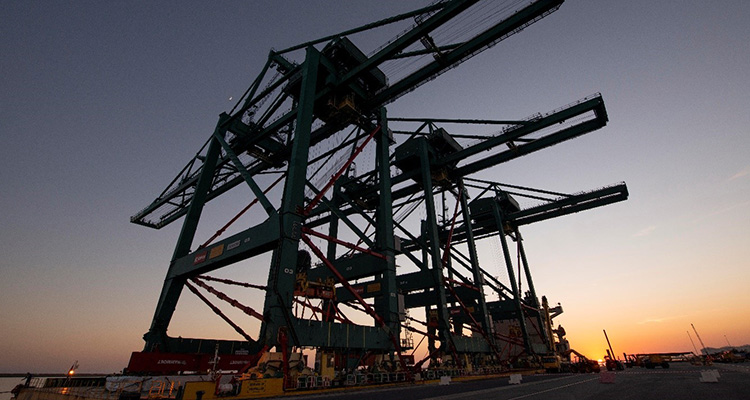
Level and structure of investment
Start of main content
E_06
Evolution of the public investment (E_06)
The evolution of the public investment by the Port Authority in recent years, in relation to the cash flow was:
| 2019 | 2020 | 2021 | |
|---|---|---|---|
| Total public investment (€) | 20,457,632 | 41,205,728 | 28,986,443 |
| Cash-flow (€) | 20,813,181 | 19,924,344 | 23,471,016 |
| RATIO (%) | 98.29% | 206.81% | 123.50% |
E_07
Evolution of outside investment (E_07)
The evolution of outside investment with respect to public investment by the Port Authority, in recent years, was:
| 2019 | 2020 | 2021 | |
|---|---|---|---|
| Private investment (€) | 18,365,000 | 27,452,000 | 47,589,000 |
| Public investment (€) | 20,457,632 | 41,205,728 | 28,986,443 |
| RATIO (%) | 89.77% | 66.62% | 164.18 |
E_08
Assessment of the renewal of assets (E_08)
The evolution of the relation of the annual investment volume and the average net assets, in recent years:
| 2019 | 2020 | 2021 | |
|---|---|---|---|
| Public investment (€) | 20,457,632 | 41,205,728 | 28,986,443 |
| Average net assets (€) | 415,408.899 | 405,777,873 | 423,145,792 |
| RATIO (%) | 4.92% | 10.15% | 6.85% |
End of main content